In the real application, when you need to add a new visualization to your web chart application, the first thing you may need to do is to bind the chart to the data. The KaxChart control from our ASP.NET AJAX enables users to bind a chart to several forms of data. The supportable data source types that can be used in KaxChart include data array, data list, database and XML file. And in this article, we will illustrate data binding KaxChart to an array object or grouped array objects. On this page, you can view free online demo of chart data binding with array. How to Bind a Chart to an Array Object
In this part, we will offer a C#.NET programming example for you on how to bind a chart to an array object. Developers can add data to pie chart, bar chart, line chart, stacked chart, scatter chart, bubble chart, gantt chart and so on. In order to let you run following C#.NET programming codes successfully in your web application, please make sure that your ASP.NET web application has installed NET Framework 3.5 or above versions and that you have installed all the necessary dlls from our ASP.NET AJAX SDK into your ASP.NET web application.
To bind a KaxChart to an array object, you need first change the DataSource property of the chart to array. Then you can specify the desired data array object using the chart DataBind() method. C# Code
Now the essential step for populating data from an array object in the chart is finished. If you have any problem in the process of data binding chart to an array object, please feel free to contact us via E-mail.
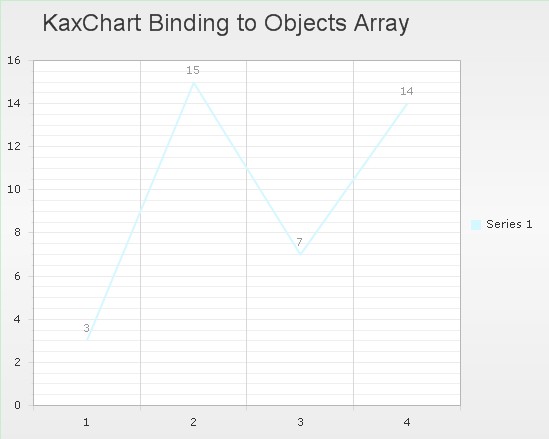
Following picture is a screen shot of above C# programming example. Each data item from the data source is showing as a data series point in web chart graphs.  How to Bind a Chart to Multiple Array Objects
Apart from display one array object in chart using data binding method, have you ever thought of data binding grouped array objects in one chart? If yes, following programming codes may offer some useful information for you.
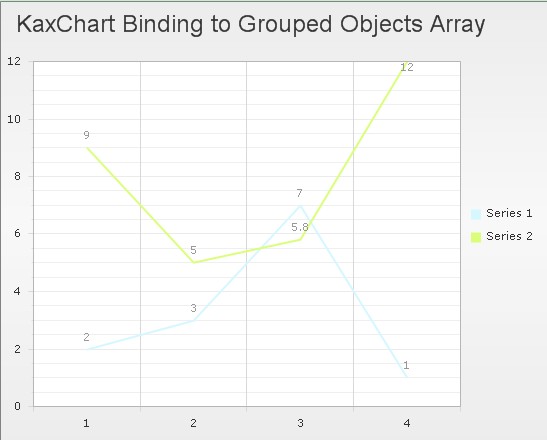
After binding chart to multiple array objects, now you can not only view the data of source array objects but also compare the contributions of these data array objects.
Following picture is a screen shot of above C# programming example. Look at your input data source, you insert two types data array, then the viewing of html chart diagram has two data lines.  Other Recommended Data Binding Applications | 
ASP.NET AJAX UI Controls ASP.NET AJAX Chart UI Control OverviewGetting StartedChart Element DiagramSeriesAxesLegendCaptionTickData GridChart Type Bar ChartPoint ChartLine ChartPie ChartArea ChartGantt ChartBubble ChartBezier ChartSpline ChartSpline Area ChartCandle Chart Chart With StackedFull Stacked ChartFeatures Automatic LayoutAutomatic Text-wrappingScrollingEmpty ValuesScale BreakMultiline LabelsWise LabelsMarking AreasMultiple TypesInteractiveDrill DownShadowEdtingData Binding Array Data List DataDatabase DataXML DataChart Style Chart SkinASP.NET AJAX Grid UI Control |