Information to Scale Breaks
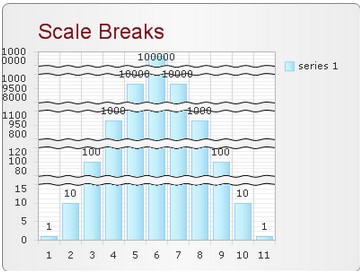
What is scale breaks in web chart? A scale break is a stripe that is added to the chart across the chart plot area for dividing an axis range into several small parts. And the number of scale breaks in the chart is not limited and the appearance of the scale breaks can be richly styled by setting proper size, color and line style.
What can we do with this scale breaks chart feature? The direct benefit of applying this scale breaks chart feature is that you can easily show different distinct ranges in the same chart plot area. Then you can make an easy comparison between low and high data values. Or you can even remove some unnecessary space when series data values have a significant difference in ranges.
In this online tutorial, we will guide you how to break off the whole chart plot area using the axis scale breaks feature. How to Set Scale Breaks Programmatically
The KaxChart control from our UI for ASP.NET AJAX offers three properties for users to use this chart axis scale breaks feature freely in their different applications, which are MaxCount, Appearance and Width. And in this section, we will firstly give a brief introduction to the functions of each supported properties and then we will attach two snippets of sample programming codes for customizing the axis scale breaks feature.
ASPX Sample Code to Set Scale Breaks Chart Feature
C# Code to Set Scale Breaks Chart Feature
To help you better know the effect that this axis scale breaks feature can bring to target chart, here we specifically attach an image which demonstrate the result of applying the scale break feature.  Other Chart Feature Recommendations
| 
ASP.NET AJAX UI Controls ASP.NET AJAX Chart UI Control OverviewGetting StartedChart Element DiagramSeriesAxesLegendCaptionTickData GridChart Type Bar ChartPoint ChartLine ChartPie ChartArea ChartGantt ChartBubble ChartBezier ChartSpline ChartSpline Area ChartCandle Chart Chart With StackedFull Stacked ChartFeatures Automatic LayoutAutomatic Text-wrappingScrollingEmpty ValuesScale Break Multiline LabelsWise LabelsMarking AreasMultiple TypesInteractiveDrill DownShadowEdtingData Binding Array DataList DataDatabase DataXML DataChart Style Chart SkinASP.NET AJAX Grid UI Control |