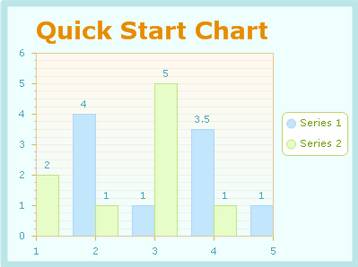
The KaxChart component is a user-directed control what aims to help users create a richly-styled and function-customized chart in ASP.NET developing platform. Thus, to help you have a general impression of the working process of the KaxChart control, we present this online guiding tutorial which will demonstrate a programming example of creating a simple chart using UI SDK for ASP.NET AJAX.
The whole ASP.NET AJAX chart creating process can be divided into following several parts. And in following text, we will guide you to build a chart in ASP.NET application step by step. Create an ASP.NET Web Application
Add Chart Control to Web Page
Add Chart Data
Customize Chart Appearance
Here we attach an image which shows the result of above ASP.NET chart creating application. If you met any problem in the ASP.NET chart creating process, please feel free to contact us. By the way, the KaxChart control is compatible with .NET Framework 3.5 and later versions.  | 
ASP.NET AJAX UI Controls ASP.NET AJAX Chart UI Control OverviewGetting Started Chart Element DiagramSeriesAxesLegendCaptionTickData GridChart Type Bar ChartPoint ChartLine ChartPie ChartArea ChartGantt ChartBubble ChartBezier ChartSpline ChartSpline Area ChartCandle Chart Chart With StackedFull Stacked ChartFeatures Automatic LayoutAutomatic Text-wrappingScrollingEmpty ValuesScale BreakMultiline LabelsWise LabelsMarking AreasMultiple TypesInteractiveDrill DownShadowEdtingData Binding Array DataList DataDatabase DataXML DataChart Style Chart SkinASP.NET AJAX Grid UI Control |