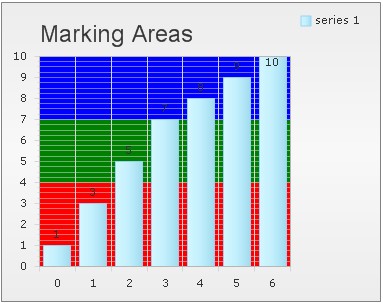
Information to Marking Areas Chart Feature
What is marking areas chart feature? What is the biggest benefit of this marking areas chart feature? How to add marking areas to target web chart? This tutorial article is created to help users find answers to above three questions.
Marking areas refer to the areas that are created with labels, filled with colors and used to highlight certain ranges within the chart. The biggest feature of the marking areas is that they could easily and visually group data. To put it in another way, the marking areas can successfully divide the whole chart data points into several distinguishing groups. Here you can view our makring area free online demo. Marking Areas Properties
The properties of marking areas can be fully customized. And here we list three properties that control the appearance, position, size and style of added marked zone.
Note: by default, the marking areas will be displayed behind the chart series. By the way, the number of marked zones that is contained in one chart is not limited. And even within one chart, the appearance and other properties of each marking area can be totally different. How to Add Marking Areas to Chart
In this part, we offer you the programming samples to modify marking areas in aspx page and to add marking areas to chart using Visual C# .NET programming code. If you meet any problem in testing above marking areas adding examples, please feel free to contact us.  ASPX
C# Code
Note: In order to meet the basic needs of running the KaxChart control, please make sure that your ASP.NET web application has installed NET Framework 3.5 or above versions and that you have installed all the necessary dlls from our ASP.NET AJAX SDK into your ASP.NET web application. Other Chart Feature Recommendations
| 
ASP.NET AJAX UI Controls ASP.NET AJAX Chart UI Control OverviewGetting StartedChart Element DiagramSeriesAxesLegendCaptionTickData GridChart Type Bar ChartPoint ChartLine ChartPie ChartArea ChartGantt ChartBubble ChartBezier ChartSpline ChartSpline Area ChartCandle Chart Chart With StackedFull Stacked ChartFeatures Automatic LayoutAutomatic Text-wrappingScrollingEmpty ValuesScale BreakMultiline LabelsWise LabelsMarking Areas Multiple TypesInteractiveDrill DownShadowEdtingData Binding Array DataList DataDatabase DataXML DataChart Style Chart SkinASP.NET AJAX Grid UI Control |