Information to Chart Scrolling Feature
Sometimes we may meet following situation that the plot area of the chart is not large enough for us to display all the data series points in a clear way. Under this situation, we may need to add a scrollbar to the chart so that viewers can scroll the chart to see the data that they want to read. Besides, to show the data in a more detailed way, we may also need the chart zooming function. And the asp.net KaxChart control enables users to add the chart scrolling and zooming functions via the chart scrolling feature. Chart Scrolling Feature Properties
In order to make sure the chart scrolling and zooming feature can be perfectly used in different web programming applications, the KaxChart control offers following several properties to help users create a fully customized scrollbar in the target html chart. ScrollMode
ScrollMode: this property offers users the ability to make the chart scrollbar visible or not. One thing that needs to be mentioned here is when you want to scroll the chart only in one axis (either X axis or Y axis), you need to set the EnableZoom property to false. XScale and YScale
XScale and YScale: these two properties allow users to change the chart zooming function programmatically on the server-side. XScale and YScale properties control the scaling effect for the X Axis and Y Axis respectively. You can define there properties using C# code in your asp.net web projects.
For instance, suppose the chart Xaxis has 30 values, then, you can display 5 data values if you set the value of Xscale as 5. If you define the value of Xscale as 3, then 10 data values will be visible in the current Xaix bar. The YScale property works the same way. XScrollOffset and YScrollOffset
XScrollOffset and YScrollOffset: these two properties control the scrolled position and they just accept the values from 0 and 1. For example, if you define the XScrollOffset as 0, then the scrollbar will be displayed at the far left side. If you set the XScrollOffset as 1, the scrollbar will be positioned at the far right side. How to Customize Chart Scrolling Function
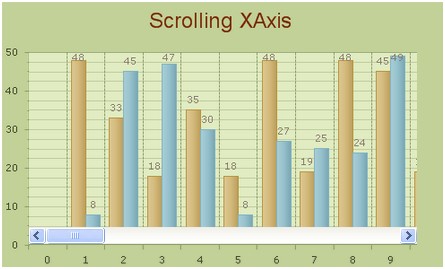
In this part, we will offer sample ASP.NET and C# programming codes to show you how to create a web chart that enables users to scroll along the Xaxis. ASPX
C# Code
With the purpose to help you have a better understanding of the chart scrolling feature, we here specifically attach an image which presents the result of above chart scrollbar adding programming application.  Other Chart Feature Recommendations
| 
ASP.NET AJAX UI Controls ASP.NET AJAX Chart UI Control OverviewGetting StartedChart Element DiagramSeriesAxesLegendCaptionTickData GridChart Type Bar ChartPoint ChartLine ChartPie ChartArea ChartGantt ChartBubble ChartBezier ChartSpline ChartSpline Area ChartCandle Chart Chart With StackedFull Stacked ChartFeatures Automatic LayoutAutomatic Text-wrappingScrolling Empty ValuesScale BreakMultiline LabelsWise LabelsMarking AreasMultiple TypesInteractiveDrill DownShadowEdtingData Binding Array DataList DataDatabase DataXML DataChart Style Chart SkinASP.NET AJAX Grid UI Control |