Kettic ASP.NET chart control provides drill down feature. Why you need drill down? In many cases, you want to view the detail information in some data series, but current chart graphs don't show these information. And now, it's necessary to provide a function to view more details from current chart graphs. The drill down functionality is able to be used to click on a graphical element like a bar, a pie segment and so on, which may stand for some data. The Drill down feature can navigate to another view that may hold some different data than the previous one. Add drill down feature to ASP.NET Chart
The drill-down is a specified area where the clicked the chart navigates to a view with greater detail. User can click on a series in the legend or a chart series item to display another chart with an expanded view of that series or series item. In this tutorial part, we will show you how to drill down the season data to month data. First, add a web chart control to your aspx page.
Then define the drill down code in the click event by C# code.
Now please look the initial view of the asp.net chart with season data. 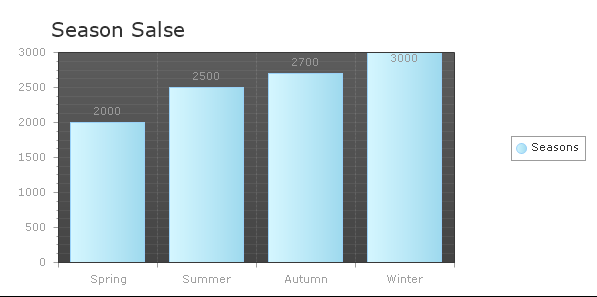 After clicking the spring bar area, you can get a new chart view by month. 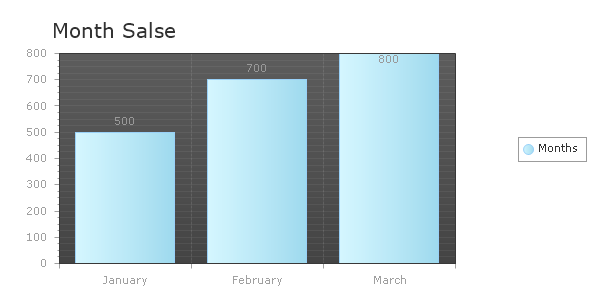 | 
ASP.NET AJAX UI Controls ASP.NET AJAX Chart UI Control OverviewGetting StartedChart Element DiagramSeriesAxesLegendCaptionTickData GridChart Type Bar ChartPoint ChartLine ChartPie ChartArea ChartGantt ChartBubble ChartBezier ChartSpline ChartSpline Area ChartCandle Chart Chart With StackedFull Stacked ChartFeatures Automatic LayoutAutomatic Text-wrappingScrollingEmpty ValuesScale BreakMultiline LabelsWise LabelsMarking AreasMultiple TypesInteractiveDrill Down ShadowEdtingData Binding Array DataList DataDatabase DataXML DataChart Style Chart SkinASP.NET AJAX Grid UI Control |