Information to Chart With Stacked
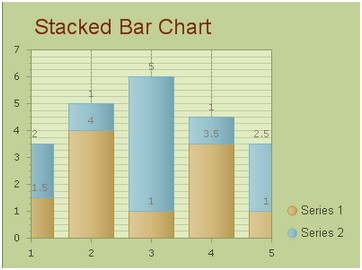
The clustered stacked chart is often used when you have two or more data series and want to view the combined values for each data series. If you also need to compare the contributions of values within data series, you may try this 100% stacked chart type. Three chart types are supported by this stacked chart of ASP.NET AJAX control, which are stacked bar chart, staked spline area chart and stacked area chart. And in this article, we will put our focus on the building of a stacked bar chart.  How to Build a Simple Stacked Bar chart
Stacked bar chart is often known as stacked column chart. The making of a simple stacked bar chart mainly contains two parts. One is to define the chart appearance and the other is to add data series to target chart. In following text, we will illustrate the stacked bar chart creating process with sample ASP.NET code.
Before that, please drag an AjaxPanel from the toolbox to an aspx web page and then put a chart control into that AjaxPanel. Basic Settings
The settings in this part have two functions, choose the chart type and set the chart appearance. And the basic settings contain four parts and can be all done within the property window.
We provide C# example to show you how to define these basic settings of stacked chart.
Bar Settings
In above section, we have customized the appearance style of created stacked bar chart in our ASP.NET AJAX application. Here we will illustrate how to add and display source data in that web stacked bar chart graphs.
As is said above, the stacked bar chart enables users to compare multiple data series. Thus, the number of data series in the stacked bar chart is not fixed and it is determined by your source data categories. Before drawing the html stacked bar chart, you can order and sort the input data group values. By default, the first data series will display at the bottom area of each bar graphics. And in following ASP.NET code, we will guide you to customize the each data series using the property ChartSeries. Another feature of the stacked bar chart is that each bar series may contain various items. And the items can be easily defined by using the property ChartSeries.Points. Besides, the axis of chart is also allowed to customized, please see the C# code below.
More settings of Series to see Chart Series Element. See Also | 
ASP.NET AJAX UI Controls ASP.NET AJAX Chart UI Control OverviewGetting StartedChart Element DiagramSeriesAxesLegendCaptionTickData GridChart Type Bar ChartPoint ChartLine ChartPie ChartArea ChartGantt ChartBubble ChartBezier ChartSpline ChartSpline Area ChartCandle Chart Chart With Stacked Full Stacked ChartFeatures Automatic LayoutAutomatic Text-wrappingScrollingEmpty ValuesScale BreakMultiline LabelsWise LabelsMarking AreasMultiple TypesInteractiveDrill DownShadowEdtingData Binding Array DataList DataDatabase DataXML DataChart Style Chart SkinASP.NET AJAX Grid UI Control |